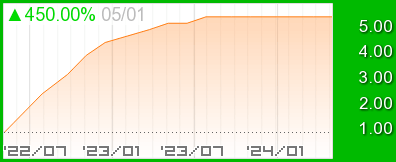
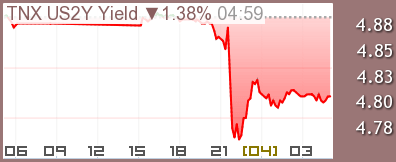
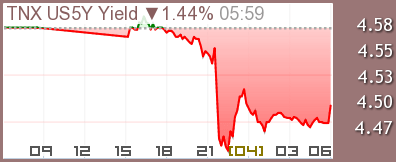
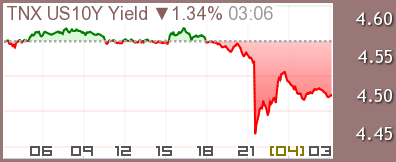
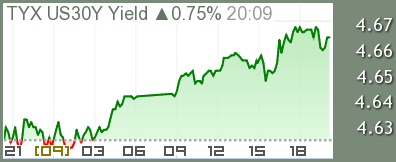
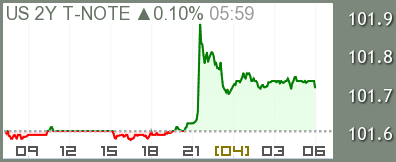
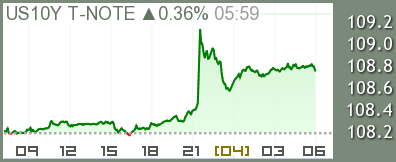
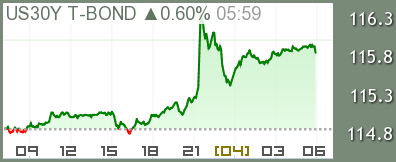
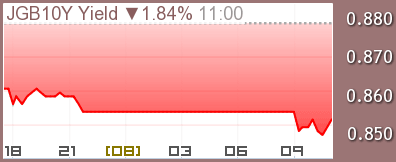
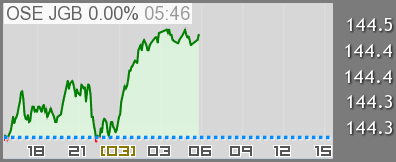
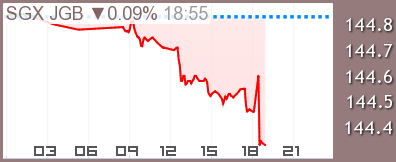
US Government bond yield Long Term
?
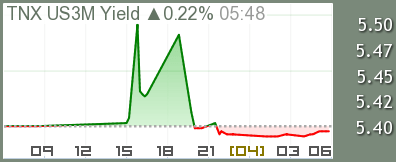
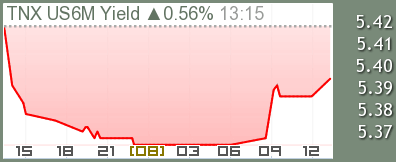
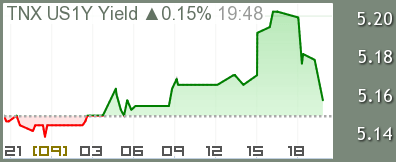
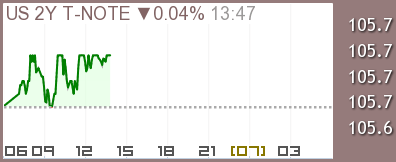
US Government bond yield Intraday
?
chart:
Yield curve
?
| |||||||||||||||||||||||||||||||||||||||||||||||||||||||||||||||||||||||||||||||||||||||||||||||||||||||||||||||||||||
| |||||||||||||||||||||||||||||||||||||||||||||||||||||||||||||||||||||||||||||||||||||||||||||||||||||||||||||||||||||
NewZealand | |
|---|---|
Australia | |
Korea | |
Taiwan | |
China | |
Hong Kong | |
Philippines | |
Thailand | |
Singapore | |
Indonesia | |
India | |
United Kingdom | |
Germany | |
France | |
Switzerland | |
Italy | |
Spain | |
Russia | |
Turkey | |
South Africa | |
Canada | |
Brazil | |
Mexico |
| [225225.jp] WorldIndexes For smartphones |
(C)StockBrainContact
Loading...
